


Series C Funding
Table of Contents
Navigating Series C Funding: Key Thresholds and Strategic Milestones
Navigating Series C funding represents a late-stage growth-equity threshold where proven business models and strong recurring revenue (often $20M-$100M+ ARR) command valuations from $100M to over $1B. At this stage, companies have validated their product-market fit and now seek capital to accelerate growth and prepare for liquidity events.
Investors evaluate companies in the late-stage startup valuation metrics through rigorous analysis of revenue quality and growth sustainability. Across series c revenue multiples, late-stage firms target net revenue retention well above 100% year-over-year, demonstrating durable customer economics. These expansion-stage valuation parameters and late-round revenue performance indicators help gauge pre-IPO financial requirements. The proceeds fuel three strategic milestones: aggressive market share expansion, both domestically and internationally, to capture category leadership; strategic acquisitions that consolidate critical technology or top-tier talent; and formalizing internal processes, often including seasoned C-suite hires, in preparation for an IPO or major liquidity event.
The regulatory environment underpinning these raises, governed by FINRA Rule 506(c) for general solicitation and accredited investor verification, demands meticulous compliance. At Zaidwood Capital, a Boutique M&A and Capital Advisory Firm, we act as a Precision Catalyst, advising founders on how to position their Sovereign Data Nexus to meet the rigorous due diligence standards of institutional Series C investors. Now that we have established the key thresholds and strategic value of Series C, let us examine the specific valuation models that investors apply to these late-stage companies.
The Investor Landscape and Core Valuation Frameworks for Series C
Before diving into the investor landscape and valuation frameworks, it helps to revisit What is Series C Funding and how it differs from earlier stages. Having established what series c funding entails, we now turn to the investors who drive these rounds and the valuation frameworks that determine pricing. At the Series C stage, the investor syndicate transforms dramatically from the angel and early-stage venture capital mix of prior rounds. Growth-equity firms such as General Atlantic and Insight Partners commonly anchor these rounds, often joined by cross-over funds like Tiger Global and Coatue, alongside sovereign wealth funds and corporate venture arms with strategic mandates. As a Boutique M&A and Capital Advisory Firm, we see most successful Series C raises involving multiple institutional investors in a syndicated structure, with deal sizes typically ranging from $30 million to $100 million or more.
The valuation of a Series C company is primarily driven by its growth profile and unit-economic efficiency. Investors focus on a core set of late-stage startup valuation metrics to determine pricing: revenue growth rate, the Rule of 40, net revenue retention, and gross margin profile. The Rule of 40 framework–where growth rate plus profit margin should equal or exceed 40%–is particularly illuminating. For high-growth companies expanding above 30% year-over-year, an aggregate score of 30 to 40 is generally acceptable because of the premium placed on top-line expansion. Capital-efficient companies growing at 15% to 30% are expected to demonstrate a higher composite score, in the 45 to 55 range, reflecting a more balanced profile between growth and profitability.
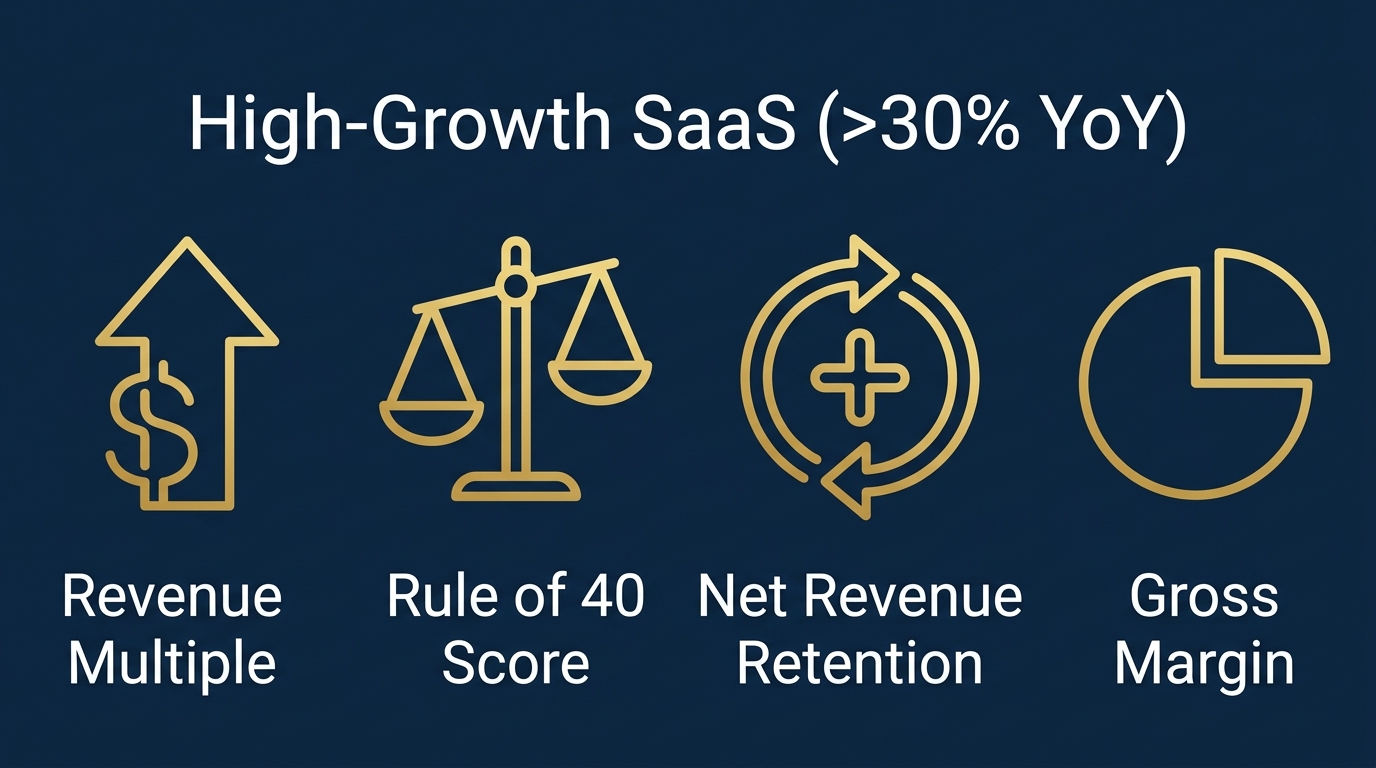
High-Growth SaaS valuation frameworks for Series C companies.
The series c funding valuation process translates these operating metrics into revenue multiples that segment companies into distinct pricing cohorts. Public SaaS company benchmarks from the Securities Industry and Financial Markets Association (SIFMA) provide the foundational comparables, and our proprietary Sovereign Data Nexus refines investor-specific pricing assumptions. Net revenue retention above 100% is table stakes for any company entering a Series C process. High-growth companies typically exhibit net revenue retention of 110% to 130%, evidencing strong expansion within the existing customer base, while capital-efficient companies generally report 100% to 115%. Gross margin expectations follow a related pattern: high-growth SaaS companies often carry 65% to 75% gross margins, reflecting the higher cost of customer acquisition and scaling, whereas capital-efficient operators demonstrate 70% to 80% margins through leaner infrastructure and disciplined spending.
The following table translates these dynamics into illustrative series c revenue multiples across two growth cohorts.
| Metric | High-Growth SaaS (>30% YoY) | Capital-Efficient SaaS (15-30% YoY) |
|---|---|---|
| Revenue Multiple | 8x-12x ARR | |
| Rule of 40 Score | 45-55 (balanced) | |
| Net Revenue Retention | 100-115% | |
| Gross Margin Expectation | 70-80% |
Walking through each row, the dispersion in revenue multiples highlights how growth tilts investor appetite. Companies exceeding 30% year-over-year growth command 12x to 18x annual recurring revenue multiples, while consistent performers in the 15% to 30% growth band see 8x to 12x multiples. The Rule of 40 scores reinforce this bifurcation: high-growth companies can trade at a lower aggregate score because expansion is valued, whereas capital-efficient firms must demonstrate disciplined profitability. Net revenue retention and gross margin bands further underscore how revenue quality influences valuation. It is important to remember that these ranges are illustrative, not guarantees. Market cycles, strategic buyer interest, and competitive dynamics all influence final pricing. As a Full-Cycle M&A advisor, we stress that the Velocity Matrix and Precision Catalyst frameworks help founders position their companies precisely within these benchmarks. Understanding these benchmarks equips you to navigate the Series C process–covered in the next section on structuring your fundraise.
Strategic Deployment of Capital and 2026 Valuation Benchmarks
Once the series c funding is secured, how it is deployed determines not only growth trajectory but also the valuation narrative for the next round. From expanding into new markets to pursuing strategic M&A, every allocation decision sends a signal about a company’s maturity, discipline, and ambition. The following analysis examines four primary deployment strategies and then maps the valuation benchmarks that late-stage startups will face in 2026, shaped by public-market dynamics and burn-rate expectations.
Strategic Uses of Series C Capital and Their Valuation Effects
The strategic allocation of a Series C round directly influences investor perception and future funding terms. We commonly observe four archetypal deployment paths, each with distinct risk, valuation impact, and timeline profiles. The table below draws on industry data from SIFMA and our proprietary deal analytics within Sovereign Data Nexus to compare these strategies.
| Strategy | Risk Profile | Valuation Impact | Typical Timeline |
|---|---|---|---|
| Market Expansion (Geo/New Vertical) | Medium – requires proven playbook and local execution | Moderate positive if unit economics hold; expansion costs can compress margins short term | 12-18 months to show ROI |
| Strategic M&A (Tuck-in / Platform) | High – integration risk, cultural friction, execution complexity | Positive if acquired tech improves platform stickiness and ARR; multiple arbitrage possible | 6-12 months to close; 12-24 months to realize synergies |
| Product Development / R&D Scale | Low to Medium – predictable if talent and roadmap are clear | Moderate to High if new product pipeline expands TAM and NRR | 12-24 months to market impact |
| Balance Sheet Strengthening / Secondary | Low – primarily a financial move, not operational | Stable – generally no valuation uplift, creates liquidity | 3-6 months |
Each strategy carries its own trade-offs. Market expansion offers moderate uplift only when unit economics hold, while secondary sales provide liquidity without moving the valuation needle. Strategic M&A, though riskier, can reshape a company’s narrative. Integrating an acquisition into a platform-scale company demands sell-side m&a expertise to navigate diligence, cultural alignment, and financial structuring. When acquired technology improves platform stickiness and annual recurring revenue (ARR), the combined entity’s valuation multiple may benefit from the type of arbitrage our Precision Catalyst engine is designed to identify. No valuation improvement is assured; execution risk remains substantial.
Beyond deployment choices, the 2026 market environment will impose specific valuation benchmarks that founders and investors must navigate – shaped by public-market signals and burn-rate discipline.
2026 Valuation Benchmarks, Burn Rate Impact, and Primary Methods
As we look toward 2026, late-stage startup valuation metrics are increasingly anchored to the performance of public market indices and the financing volumes tracked by SIFMA. When public equities cool, discount rates applied to late-stage private companies rise, directly compressing the series c revenue multiples investors are willing to pay. A higher cash burn rate further pressures these multiples because it widens the yield gap between what a startup must deliver and what risk-free assets return. This dynamic is central to the three valuation frameworks Series C investors rely on.
First, discounted cash flow (DCF) analysis becomes sensitive to burn rate through the terminal value calculation – sustained high burn lowers free cash flow projections, increasing the required discount rate and compressing present value. Second, market comparable company (comps) analysis links implied multiples to public-company trading ranges; if public market multiples compress, late-stage private valuations typically follow, and a high burn rate signals execution risk that compounds the discount. Third, leveraged buyout (LBO) analysis – used by some growth-equity investors – models a return based on debt service capacity; elevated burn rate constrains available cash for debt, reducing the viable leverage and the resulting valuation. Our Sovereign Data Nexus platform aggregates transaction-level data across these methods, allowing clients to benchmark against real-world deal comps rather than theoretical ranges.
SIFMA data on capital formation and M&A financing trends confirms that disciplined cash management and a credible path to profitability will be the hallmark of companies that command premium valuations in 2026. Founders who align their capital deployment with the realities of public-market valuation frameworks position themselves favorably for subsequent rounds. This alignment of deployment strategy and valuation discipline is the foundation upon which successful Series C exits are built, leading naturally to the fundraising tactics and exit planning discussions that follow.
Preparing Financials and Pitch Decks for Series C Due Diligence
Once the investor target list is set, the next critical step is preparing the financials and pitch deck for the rigorous due diligence process at the Series C level. For companies pursuing Series C funding, organized documentation and a compelling narrative demonstrate operational maturity and de-risk the investment, setting the stage for successful negotiations.
Meeting Series C Due Diligence Standards and Disclosure Requirements
Series C investors scrutinize every aspect of a company’s financial and operational health. Meeting their due diligence standards demands meticulous preparation. Begin with audited financials: at least three years of audited profit & loss statements, balance sheets, and cash flow statements, complemented by current-year financials and a three-year forward-looking projection model that clearly builds ARR from existing and new customer cohorts. Next, present SaaS unit economics with absolute clarity–the LTV/CAC ratio, monthly and annual churn rates, net dollar retention, and customer acquisition cost payback period must be clearly displayed.
The capitalization table must be immaculate. Every convertible note, SAFE, and preferred stock right must be fully converted and recorded, and any outstanding warrant coverage disclosed without ambiguity. A messy cap table can scare away sophisticated investors and delay the closing. Organize your data room around a narrative executive summary that links historical performance to your Series C investment thesis–explain how the new capital will fuel market expansion, accelerate product maturation, and shorten the path to profitability.
Regulatory compliance is non-negotiable. FINRA standards for securities offerings prescribe that your disclosure materials must include a risk factor section, a detailed use-of-proceeds statement, and a management discussion and analysis that honestly portrays both strengths and challenges. Zaidwood Capital, a Boutique M&A and Capital Advisory Firm, helps founders navigate these requirements. Engaging our team to manage the due diligence process can streamline preparation and often offsets tech M&A advisory fees by accelerating the fundraising timeline. At our West Palm Beach headquarters, we combine deep institutional knowledge with proprietary tools like Precision Catalyst and Velocity Matrix to keep every document and metric aligned with investor expectations.
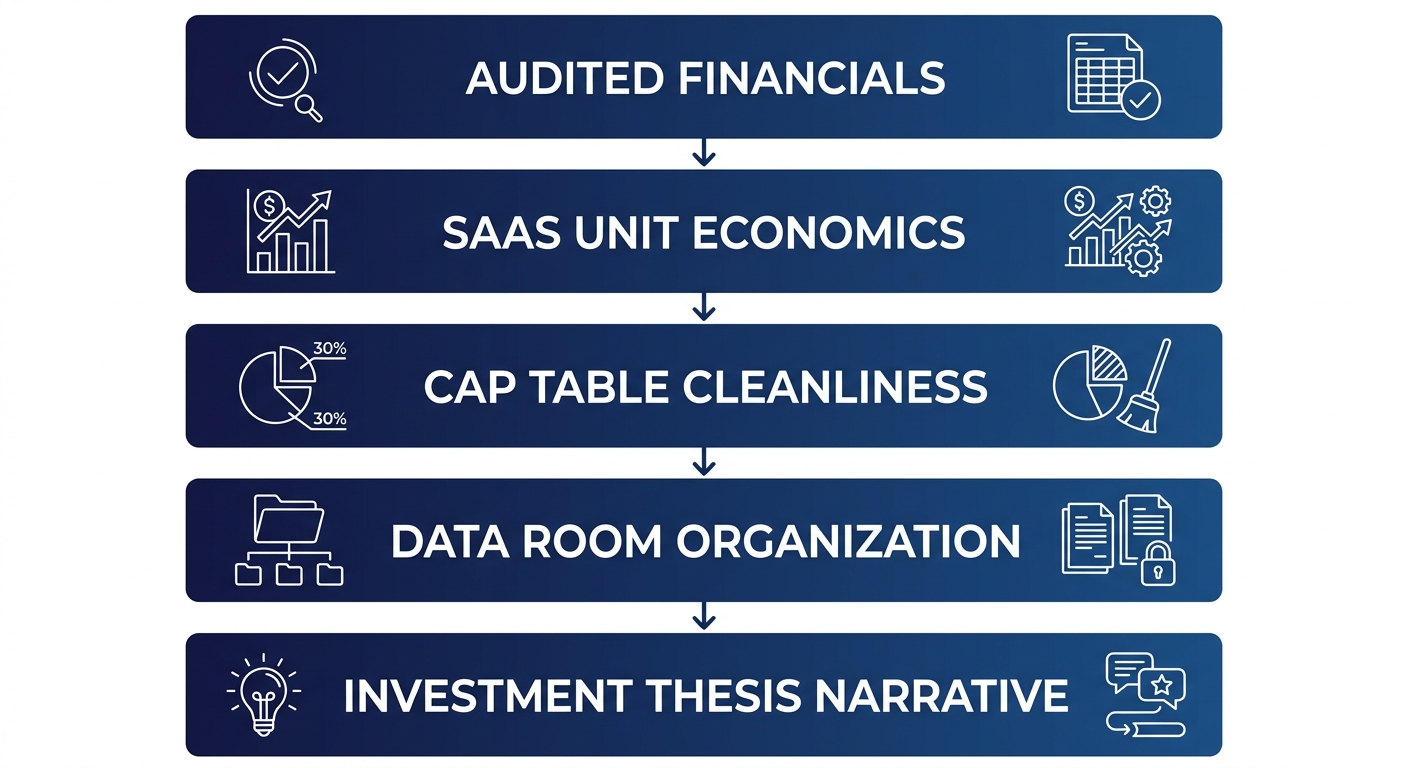
Vertical process flow for Series C due diligence preparation.
How ARR Growth and Gross Margins Determine Your Revenue Multiple
Series C funding valuations are driven by late-stage startup valuation metrics, particularly the relationship between annual recurring revenue growth and gross margin. These two levers directly produce the Series C revenue multiples that growth-stage investors are willing to assign. Drawing on Zaidwood Capital’s proprietary Sovereign Data Nexus–a database of thousands of comparable financing rounds–the following table maps ARR growth rates and gross margin bands to observed revenue multiples at the Series C stage.
| ARR Growth Rate (YoY) | Gross Margin <60% | Gross Margin 60-75% | Gross Margin >75% | ||||||||||||||||||||||||||
|---|---|---|---|---|---|---|---|---|---|---|---|---|---|---|---|---|---|---|---|---|---|---|---|---|---|---|---|---|---|
| <30% | 4x-6x ARR | 6x-10x ARR | 30-60% | 6x-10x ARR | 10x-14x ARR | >60% | 10x-14x ARR | 14x-18x ARR | As the table shows, the revenue multiple climbs sharply when both growth and gross margin improve. For example, if a startup’s ARR is expanding at 40% year-over-year with gross margins of 70%, the company can reasonably expect a Series C valuation multiple in the popular 10x-14x band. In contrast, a company that accelerates growth above 60% while maintaining gross margins above 75% can command revenue multiples of 18x to 22x or higher. These revenue-based valuation for Series C benchmarks emphasize that even modest incremental gains in either metric can translate into a significantly richer funding round.
Beyond understanding the multiple, founders can take concrete steps to strengthen their position before kicking off fund-raising. Shifting the revenue mix toward higher-margin subscription tiers, optimizing cloud infrastructure spending, and increasing the proportion of professional services (when those services deliver superior margins) all lift gross margin. Likewise, reducing churn and boosting net dollar retention raise effective ARR growth, making the company more appealing to late-stage investors. Our team at Zaidwood Capital works with founders to model these improvements and quantify their effect on projected revenue multiples, enabling data-driven pricing conversations. With your financials and pitch deck fully vetted, you are now ready to enter term sheet negotiations with a clear understanding of your valuation range. The information provided here is for educational purposes and does not constitute an offer or solicitation. Securities are offered through Finalis Securities LLC; Zaidwood Capital is not a registered broker-dealer. Investments involve risk, and past performance does not guarantee future results. Series C vs. IPO: Timing, Terminal Value, and Sector-Specific MultiplesDeciding whether to raise Series C funding, pursue an IPO, or explore a strategic acquisition is a defining choice for late-stage startups. Terminal value–the estimated value at exit–anchors this decision. We calculate terminal value using a free-cash-flow multiple applied to projected year-5 cash flows, tailored to sector growth profiles. Understanding late-stage startup valuation metrics and current series c revenue multiples equips founders to evaluate these paths. Calculating Terminal Value and Comparing Revenue MultiplesWe base terminal value assumptions on public and private benchmarks. According to SIFMA data, current revenue multiples for public SaaS companies trade below their 2021-2022 peaks. Zaidwood Capital’s proprietary data (Sovereign Data Nexus) adds context for late-stage private valuations. The table below summarizes sector-specific multiples, implied growth, and terminal value assumptions:
AI-native SaaS commands 14x-22x ARR, with implied growth of 50-80% for the coming year. Traditional B2B SaaS trades at 8x-14x ARR (20-40% growth), and hardware-enabled/IoT SaaS at 4x-8x ARR (10-20% growth). These multiples sit below the 2021 peaks of 18x-30x, 12x-20x, and 6x-12x, respectively. For late-stage startups, current multiples influence whether a Series C round, an IPO, or an acquisition offers the most favorable outcome. AI-native firms may still find private markets receptive, while traditional SaaS companies might favor an IPO if growth decelerates. When evaluating a strategic acquisition, founders should review tech M&A advisory cost models to understand transaction costs. The choice between another Series C round and an IPO depends on market conditions, growth trajectory, and the ability to sustain multiples. We help founders map their metrics to determine the optimal strategy. Investment decisions involve risk; past performance does not guarantee future results. This decision framework directly informs our approach to capital formation strategies, which we turn to next. Frequently Asked Questions About Series C FundingSeries C funding marks a pivotal growth stage for late-stage startups. Below, we address key questions. What is Series C funding and how does it differ from earlier rounds? What valuation metrics are common for Series C companies? What regulatory disclosures are required for a Series C raise? How can Zaidwood Capital help with Series C advisory? Positioning Your Company for Late-Stage Capital SuccessBuilding on earlier-stage foundations, securing series C funding demands precise positioning. As a Boutique M&A and Capital Advisory Firm, we target institutional investors for Series C using our Sovereign Data Nexus platform, engage them digitally with Precision Catalyst, and accelerate capital formation via the Velocity Matrix, supported by a network of 4,000+ investors and $15B+ in capital. We highlight the late-stage startup valuation metrics investors prioritize for series C funding: series C revenue multiples and growth rates. Once positioned, target the right institutional investors. Investments involve risk; Zaidwood Capital is not a registered broker-dealer. Resources
Explore FINRA’s BrokerCheck and Regulatory Compliance Tools
Find SIFMA Capital Markets Advocacy and Compliance Resources 



|