


Technology Investment Banking Services
Table of Contents
Understanding Technology Investment Banking Services for Growth-Stage Companies
To understand technology investment banking services, first consider what is an investment bank. Technology investment banking adapts that core function–M&A advisory, capital formation through equity and debt, and strategic advisory–to the unique dynamics of the technology sector, where recurring revenue and growth metrics drive value.
For growth-stage companies with $10 million to $100 million in revenue, valuation hinges on recurring revenue, growth rate, and market share rather than traditional assets, demanding a firm grasp of software company valuation multiples. Technology investment banking also sets itself apart through pace: cross-border transactions, multi-jurisdiction due diligence, and compressed timelines require sector-specific dexterity that generalist advisory cannot deliver.
Boutique firms like Zaidwood Capital serve this need by offering deep sector expertise, proprietary data through platforms such as Sovereign Data Nexus, and access to a curated investor network without the conflicts common at large banks. For transactions under $500 million, management teams often rely on middle market tech m&a advisory where specialized insight directly shapes outcomes. The Securities Industry and Financial Markets Association (SIFMA) provides the overarching framework that governs all investment banking activities, including those we execute for technology clients. Any securities transactions are facilitated through Finalis Securities LLC. Among these services, M&A advisory and capital formation are particularly critical for growth-stage companies, as we explore next.
Core Concepts of Technology Investment Banking
At the heart of technology investment banking services lies a deep understanding of valuation — the ability to quantify what a software company, an AI platform, or a tech-enabled service is truly worth. A Technology Investment Bank applies these core concepts to guide middle market transactions with precision. As a Boutique M&A and Capital Advisory Firm, we rely on these frameworks to advise founders and CEOs through every stage of the deal lifecycle.
Revenue multiples and EBITDA multiples are the two primary yardsticks. According to 2025-2026 preliminary data from SIFMA and FINRA, software company valuation multiples in the United States range from 6x to 12x recurring revenue for SaaS companies; profitable firms also trade on EBITDA multiples of 15x to 25x. However, many growth-stage tech firms are pre-profit. When EBITDA is negative, the valuation rests solely on revenue and growth trajectory. In middle market tech M&A advisory in the US, it is common for companies with sticky recurring revenue to command premium multiples even before reaching profitability.
To understand how these multiples vary across sub-sectors, review the following median ranges.
| Sub-Sector | Median Revenue Multiple | Median EBITDA Multiple (if positive) | Key Drivers |
|---|---|---|---|
| SaaS (Recurring Revenue) | 6x-12x | 15x-25x | Rule of 40, Net Revenue Retention |
| AI / Machine Learning | 10x-20x | 20x-35x | IP portfolio, growth rate, total addressable market |
| Tech-Enabled Services | 2x-5x | 8x-12x | Recurring vs. project revenue, labor intensity |
These multiples are based on 2025-2026 preliminary data from industry reports and SIFMA/FINRA market analyses. Actual multiples vary by company size, growth rate, and market conditions.
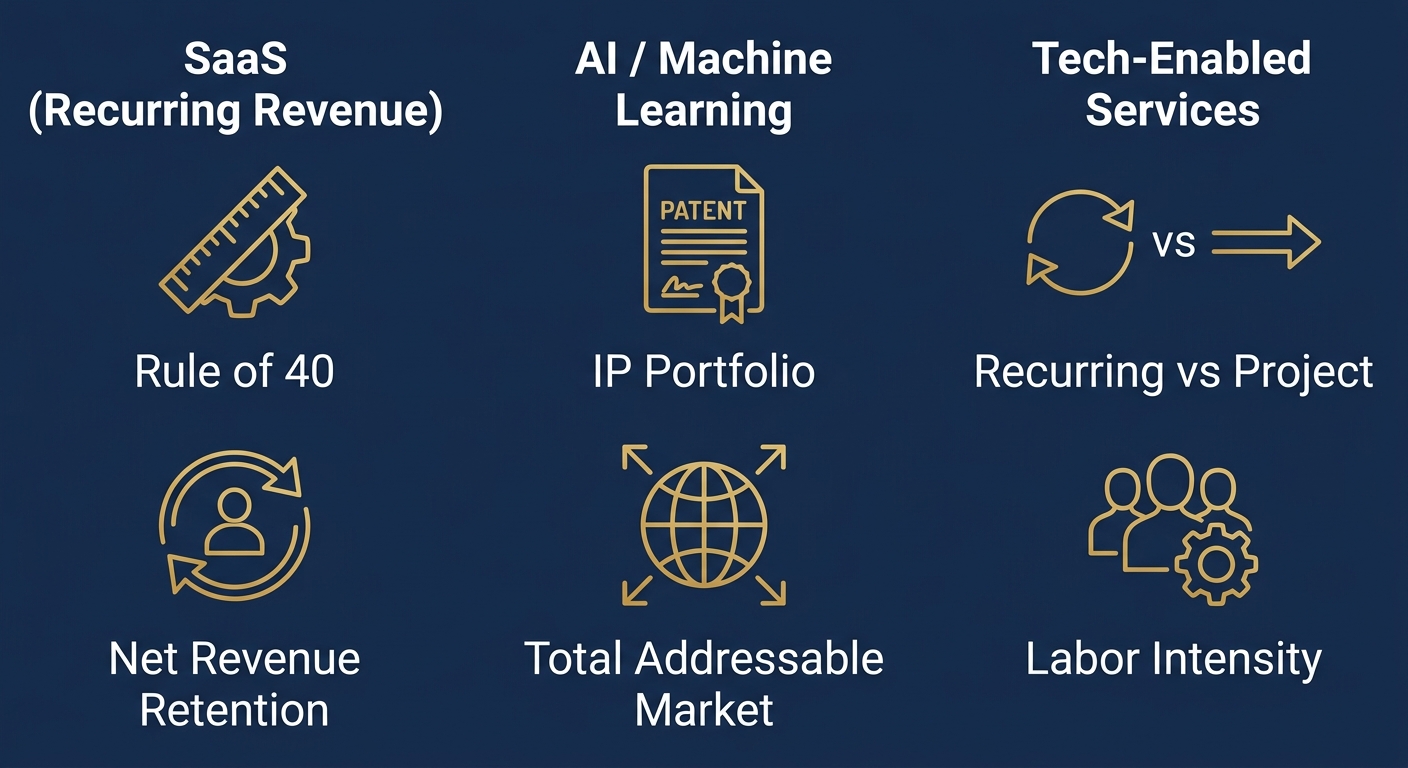
SaaS companies with strong Rule of 40 metrics and net revenue retention above 120% typically command the upper end of those multiples, while AI and machine learning firms benefit from patented intellectual property and a massive total addressable market that justify premium valuations. Tech-enabled services, on the other hand, trade at lower revenue multiples (2x-5x) because they carry higher labor intensity and rely more heavily on project-based work, making recurring revenue less predictable.
The Rule of 40 — requiring that revenue growth plus profit margin exceed 40% — is a key benchmark for SaaS valuations. Net Revenue Retention above 120% indicates strong customer loyalty and expansion potential. For AI startups, a defensible IP portfolio and a large addressable market are the most critical drivers. Meanwhile, in tech-enabled services, labor cost structure and the proportion of recurring versus project revenue heavily influence multiples.
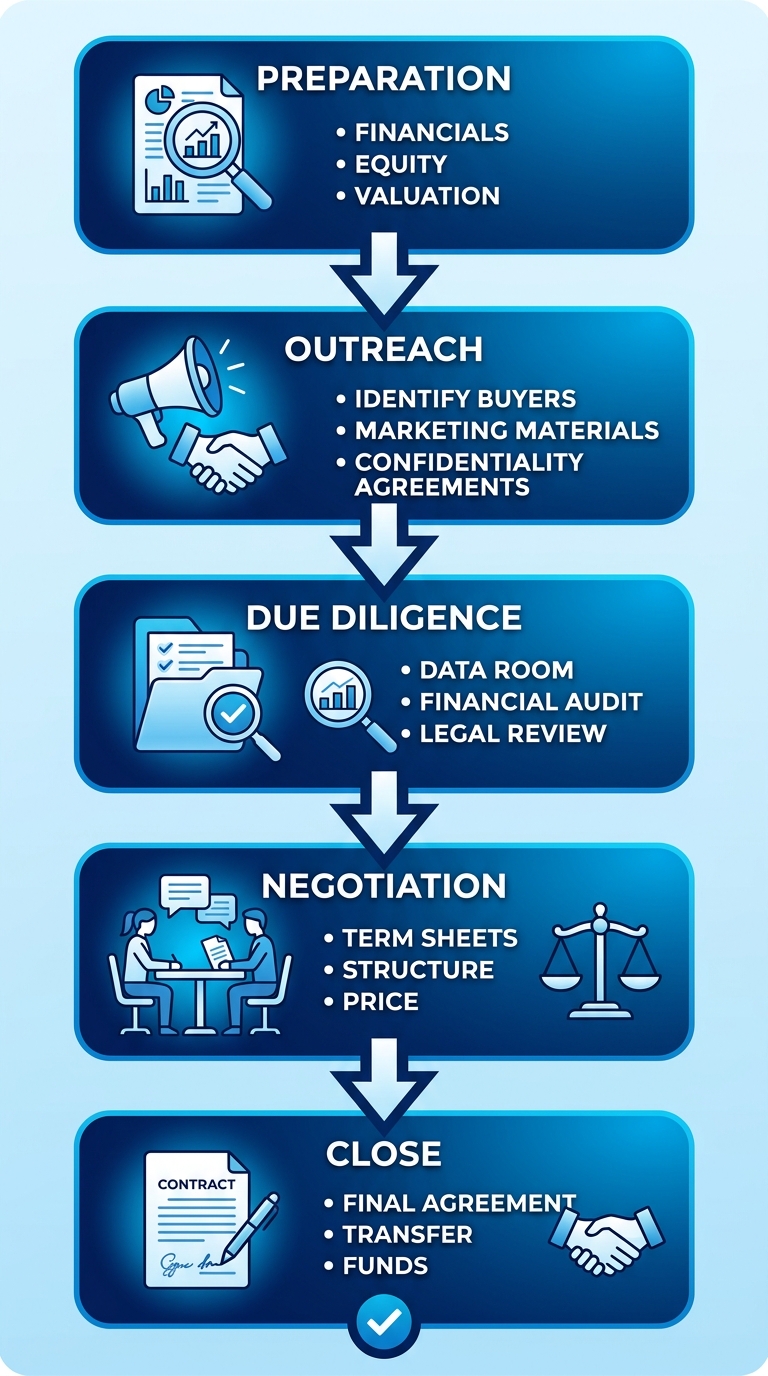
Five-stage M&A process flow for technology sell-side transactions
Technology Investment Banking Infographic: SaaS, AI, and Tech-Enabled Services Valuation Drivers.
With these sub-sector benchmarks in mind, the next stage is to understand how valuation drives each phase of the M&A deal lifecycle.
The Technology M&A Process and Valuation Landscape
The Technology M&A Deal Lifecycle: From Engagement to Close
Navigating the complex terrain of Tech Mergers And Acquisitions requires a structured approach from initial engagement to final close. At Zaidwood Capital, a Boutique M&A and Capital Advisory Firm, we guide middle-market technology companies through each phase of a full-cycle M&A process, leveraging our Sovereign Data Nexus and Precision Catalyst frameworks to drive optimal outcomes. The sell-side engagement typically spans four to six months, moving through five distinct phases.
Technology Investment Banking Infographic: SaaS, AI, and Tech-Enabled Services Valuation Drivers.
Five-stage M&A process flow for technology sell-side transactions
Preparation forms the foundation, where we develop positioning materials, clean financials, and build a data room that showcases recurring revenue metrics and growth trajectories. This phase consumes the first four to six weeks and is critical for aligning valuation expectations. The outreach phase follows, during which our Velocity Matrix connects sellers with a globally curated pool of strategic and financial buyers. Due diligence then intensifies, typically lasting six to ten weeks, as buyers validate technology assets, customer contracts, and compliance frameworks. Negotiation and closing round out the cycle, with definitive agreements executed and funds transferred. Throughout this lifecycle, we assist companies requiring technology investment banking services in the US market without ever guaranteeing specific outcomes.
Key Valuation Metrics for SaaS and AI Software Companies
When we evaluate software company valuation multiples for founders, we anchor our analysis in the metrics that sophisticated acquirers prioritize. Annual recurring revenue (ARR) sits at the center of most SaaS valuation frameworks, with premium multiples attached to businesses exceeding $5 million in ARR and demonstrating consistent quarter-over-quarter growth. Net revenue retention (NRR) above 110 percent signals strong product-market fit and expansion capacity, directly lifting enterprise value.
Gross margin is equally decisive. According to industry data from the Securities Industry and Financial Markets Association (SIFMA), publicly reported technology transactions show that businesses maintaining 80-plus percent gross margins consistently achieve valuation multiples at the upper end of comparable ranges. The Rule of 40–balancing growth rate and profit margin–serves as a shorthand lens for financial buyers, who often fund acquisitions with leverage and therefore scrutinize free cash flow generation. As a middle market tech m&a advisory in West Palm Beach, we integrate these metrics into a Velocity Matrix that benchmarks each company against sector-specific transaction data, ensuring that our clients understand exactly how buyers will model their business before entering a process.
Strategic vs. Financial Buyers: How Advisors Identify the Right Partner
Understanding the difference between strategic and financial buyers is essential for positioning a technology company for sale, as each buyer class evaluates deals through a fundamentally different lens. Strategic buyers–typically large corporates–pursue acquisitions to capture synergies, access proprietary technology, or enter adjacent markets. They often assign higher valuations because they can model cost savings and cross-selling revenue into their internal projections. Financial buyers, by contrast, focus on return on invested capital, operational improvement, and platform-building within a defined hold period.
The following table, built with reference data from SIFMA and FINRA, outlines the distinctions that guide our partner identification process.
| Buyer Type | Primary Objective | Typical Valuation Multiple | Post-Acquisition Plan |
|---|---|---|---|
| Strategic Buyer (Corporate) | Synergy capture, technology access, market expansion | 10x-20x EBITDA (synergy-adjusted) | Integration into existing operations, often retain management |
| Financial Buyer (Private Equity / VC) | Return on investment, platform build, operational improvement | 8x-14x EBITDA (conservative, leverage-driven) | Hold for 3-7 years, drive growth via add-ons then exit |
Source: SIFMA Capital Markets Fact Book, FINRA Market Data. Multiples are indicative ranges for middle-market technology firms (2025-2026).
These ranges are indicative, based on aggregated transaction data reported by FINRA and SIFMA, and should not be interpreted as promised outcomes for any specific engagement. In practice, we calibrate our outreach strategy to the buyer type most likely to align with a founder’s goals. Strategic buyers may offer top-tier valuations but demand deeper integration, while financial buyers bring operational expertise and a clear exit roadmap. Understanding the difference between these buyer types allows us to tailor our advisory approach–a topic we turn to next.
Preparing for a Successful Fundraising or M&A Event
Once you understand the landscape of middle-market transactions, the next step is thorough preparation. A successful fundraising or M&A event demands investor-ready materials, the right advisory partner, and a clear understanding of fee structures. Engaging professional technology investment banking services early can streamline every stage and increase the likelihood of a favorable outcome.
Preparing Investor-Ready Materials and Financial Projections
A comprehensive investor package is the foundation of any deal. We help technology companies assemble the following essential components:
- Pitch Deck (10-15 slides): Covers the problem, solution, market opportunity, traction, team background, and high-level financials.
- Business Plan: An executive summary, market analysis, product/service description, marketing strategy, and operational plan that articulates the company’s vision.
- Financial Projections (3-5 years): Detailed income statement, balance sheet, and cash flow projections. When setting valuation expectations, reference current software company valuation multiples to ensure your model is grounded in market reality.
- Data Room: A secure, centralized repository for legal documents, customer contracts, intellectual property filings, and historical financial statements.
By leveraging our proprietary Velocity Matrix framework, we accelerate this preparation without sacrificing accuracy, giving founding teams a competitive edge in the process.
Choosing the Right Middle Market Tech M&A Advisor
Selecting the right advisor can dramatically influence deal outcomes. We recommend evaluating firms against four key dimensions:
- Industry Expertise: Look for a deep, demonstrable focus on technology and middle-market transactions. A firm that understands sector-specific growth levers and valuation drivers is essential.
- Transaction Track Record: Review the number of deals closed, aggregate transaction volumes, and the mix of sell-side, buy-side, and growth equity engagements.
- Network: A broad network of institutional investors, strategic buyers, and lenders can compress timelines and expand transaction options.
- Cultural Fit: The advisory team should align with your company’s values, communication style, and long-term vision.
At Zaidwood Capital, we differentiate by combining deep middle market tech m&a advisory experience with proprietary tools: Sovereign Data Nexus for data-driven market intelligence and Precision Catalyst for AI-enhanced investor matchmaking. When evaluating firms, consider their full suite of investment banking advisory services and how they align with your needs.
Understanding Fee Structures and Engagement Terms
Fee structures in boutique technology investment banking vary by engagement type, but understanding common models helps executives negotiate from an informed position. Industry data from the Securities Industry and Financial Markets Association (SIFMA) and regulatory guidance from the Financial Industry Regulatory Authority (FINRA) highlight three primary approaches used in middle-market M&A advisory:
| Fee Model | Upfront Commitment | Success Fee (as % of deal value) | Best Suited For |
|---|---|---|---|
| Retainer + Success Fee | Monthly retainer (e.g., $10k-$25k) | 3-7% of transaction enterprise value | Most common; aligns advisor incentive while covering process costs |
| Monthly Retainer Only (Flat Fee) | Higher monthly fee (e.g., $30k-$60k) | None | Companies wanting predictable costs, or when success fee structure is undesirable |
| Success Fee Only (No Retainer) | None | Higher rate, typically 7-10% | Large, well-prepared deals; advisor takes full transaction risk |
The retainer-plus-success fee model remains the most prevalent because it balances an upfront commitment with outcome-based compensation. Actual terms–especially retainer amounts and success fee percentages–vary widely based on deal size, complexity, and the scope of advisory services. No single model is universally superior; the right choice depends on your company’s preparedness and strategic priorities.
As with any securities transaction, this information is for educational purposes only and does not constitute an offer or solicitation. Investments involve risk, and past performance does not guarantee future results. Securities are offered through Finalis Securities LLC; Zaidwood Capital is not a registered broker-dealer and is unaffiliated with Finalis.
Advanced Valuation Considerations for High-Growth Tech Firms
Building on fundamental valuation principles, we now turn to advanced considerations specific to high-growth technology firms. Standard valuation techniques often fall short for these companies due to negative earnings, uncertain cash flows, and high growth expectations. In technology investment banking services, a robust approach requires blending multiple methods to capture both intrinsic and market-based value perspectives.
The following table compares three primary valuation methods commonly used for high-growth technology companies.
| Valuation Method | Key Inputs | Strengths | Weaknesses |
|---|---|---|---|
| Discounted Cash Flow (DCF) | Projected cash flows, terminal value, WACC | Theoretically robust; reflects company-specific performance | Highly sensitive to assumptions; less useful for loss-making companies |
| Market Comparables (Guideline Public Companies) | Revenue or EBITDA multiples of publicly traded peers | Market-driven, current, easy to communicate | May not capture company-specific premium/discount; peer selection is subjective |
| Precedent Transactions | Multiples from comparable M&A deals | Reflects actual control premiums paid | Deal-specific factors may distort comparability; data lags |
According to industry guidance from the Securities Industry and Financial Markets Association (SIFMA) and the Financial Industry Regulatory Authority (FINRA), a combination of these methods yields the most robust valuation. At Zaidwood Capital, a Boutique M&A and Capital Advisory Firm, we apply this multi-method framework to deliver tailored business valuation services.
Discounted Cash Flow (DCF)
As the table highlights, DCF is theoretically robust but highly sensitive to terminal value and weighted average cost of capital (WACC) assumptions. For loss-making companies, the reliance on future cash flow projections can diminish its practical utility. We therefore use DCF as a foundational check, paired with market-based approaches, to avoid overreliance on speculative forecasts.
Market Comparables (Guideline Public Companies)
The market comparables method, as shown, is market-driven but requires careful peer selection. When analyzing software company valuation multiples, we often favor revenue-based metrics over EBITDA for high-growth, unprofitable firms. This approach provides a current-market perspective that is easy for investors and acquirers to understand, though it may not fully capture company-specific strategic premiums.
Precedent Transactions
Precedent transactions reflect real control premiums paid in comparable M&A deals, as the table indicates, offering a unique acquisition-focused lens. However, deal-specific factors such as buyer synergies or distressed circumstances can distort comparability. In middle market tech m&a advisory, we use transaction multiples to benchmark pricing and ground negotiations in real-world deal data.
To understand how investment banks apply these methods, see our guide on what is an investment bank.
Frequently Asked Questions About Technology Investment Banking
This FAQ covers key concepts in technology investment banking services.
What is an investment bank, and how does it support technology companies? An investment bank assists companies with capital raising and M&A, regulated by FINRA; as a boutique M&A and capital advisory firm, Zaidwood Capital serves growth-stage technology companies.
How is the Rule of 40 used to value SaaS companies? The Rule of 40, which combines revenue growth and free cash flow margin, is a key SaaS valuation benchmark. We use software company valuation multiples alongside this metric; typical multiples appear in the table below.
| Growth Rate (ARR Growth) | Profitability (FCF Margin) | Rule of 40 Score | Typical Revenue Multiple |
|---|---|---|---|
| >40% | Negative to breakeven | 30-50 | 10x-18x |
| 20-40% | 5-15% | 25-55 | 6x-12x |
| <20% | >20% | 30-40 | 4x-8x |
What revenue multiples do middle-market technology companies typically realize through middle market tech M&A advisory? As shown in the table, middle-market tech firms achieve revenue multiples from 4x to 18x based on growth and profitability. We help founders position their companies within these ranges using rigorous financial analysis.
For personalized guidance, contact Zaidwood Capital.
Partnering with Zaidwood Capital for Your Technology M&A Journey
When you need expert technology investment banking services, partner with Zaidwood Capital. Our Sovereign Data Nexus and AI-driven Precision Catalyst reveal high-value acquisition targets and investor matches. The Velocity Matrix accelerates due diligence and closing, leveraging insights from 350+ deals and $24.4B+ of transaction volume. With a network of 4,000+ global investors and $15B+ in accessible capital, our middle market tech M&A advisory delivers outcomes. We guide you from valuation to close, drawing on 80+ years of combined experience. Contact us today to begin your technology M&A journey.
Resources


